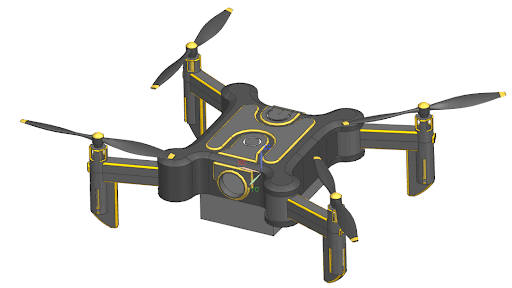
Project Overview
Loading and Boundary Conditions
Since the mass of the drone was 55 grams, it was easily determined through Fg= mg that the force of gravity acting on the entire drone was 0.534N. Assuming that this force was distributed equally among each of the four propellers, the force of gravity that each propeller would have to overcome for lift was found to be 0.135 N. However, before FEA could be conducted, the thrust force from a propeller, or FT, had to be estimated. According to a NASA reference sheet, FT = 0.5ρA(Ve^2- Vo^2). The density, of air, which is the medium the propellers are assumed to be moving through, is 1.225 kgm^-3, the area, A, that the force is being acted upon is found from the design and is 0.000158107 m^2 for both blades of the propeller, and Vo is assumed to be zero since the drone is assumed to be flying in stable conditions where no air is going into the propeller.
Feature title.
The missing piece is Ve, which is the speed of the air coming out from the propellers. This piece is found through the equation, VP= 0.5(Ve-Vo), where VP is the speed of the propellers and V0 is assumed to be zero once again. VP is found using the relationship VP= r(2π/60)RPM. Since the RPM isn’t given either, it can be approximated by multiplying the kV rating of a motor by the voltage of the motor. A cheap motor from amazon can be used as a model for this drone. The most common cheap motor on amazon has a kV rating of 2300 and a voltage of 3.7 volts, which means the average RPM can be found to be about 8510 rotations per minute. Using this value and the radius of the propeller blade from the model, where r is equal to 0.0214 meters, VP is 19.1 ms-1, Ve is 38.2 ms-1, and FT, or the thrust force per propeller, is approximated to be 0.1413N.
Assumptions
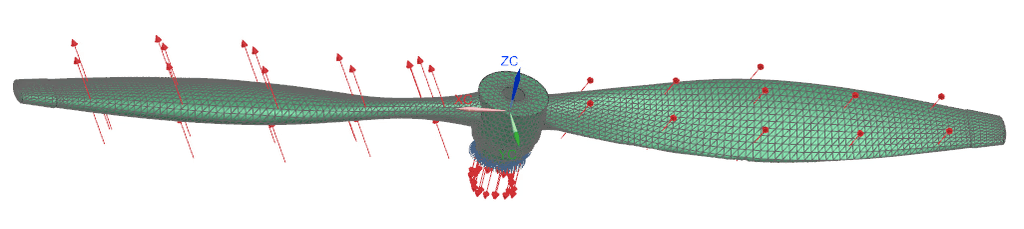
The thrust force per propeller can be compared to the force of gravity that each propeller must overcome for lift. It is expected that at the average RPM, FT would be greater than Fg, and from the previous analysis, this prediction is confirmed, as 0.1413N > 0.135N. The assumption with the previous analysis of the situation is that the propellers aren’t spinning in the simulation, so the velocity of propellers and the force generated by the spinning blades is directly applied to the blades. In other words, this is simulated as if the blades aren’t spinning at all, but instead experiencing the force they would be experiencing if they were spinning. In this assumption, the propeller is stationary at the bottom, which means it experiences a fixed constraint at the face where it interacts with the body of the drone. This also the same face the gravity force acts on since it is the location where the downward pull of gravity would be taking effect on the propeller body. The thrust force acts on the bottom of the propeller blades, in the direction perpendicular to the surface of the blades, as this is how lift is generated.
Mesh Sizing and Convergence
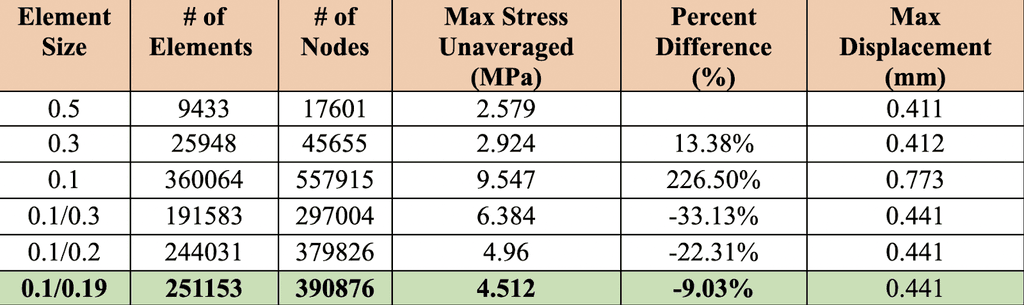
Different mesh sizes were chosen based on the convergence test, where mesh sizes and combinations are tested until the percent difference between the current and previous test is less than 10%. As seen in the table below, reaching this threshold took multiple attempts. The obvious outlier is the simulation with the element size of 0.1, where the unaveraged maximum stress has a percent difference of 226.5% over the previous value. This is likely due to simulation error, as the three mixed mesh combinations that follow do end up converging. It can be shown that values converge due to an increased number of nodes across the stress gradient. This is shown below, where percent difference is plotted with respect to the number of nodes. It is clear that as the number of nodes increases, the percent difference becomes closer to zero, implying convergence and a more accurate value for the maximum unaveraged stress.
Identifying Areas of High & Low Stress
Before simulation, the round piece of the propeller body in the center (circular hub) was removed, as this piece did not create any structural rigidity support for the structures undergoing stress. (In hindsight, I don't recommend doing this, as the fixed constraint was placed on the bottom of the circular hub, meaning that it would contribute to the overall rigidity of the blades under stress.)
To create the ideal combination of mesh sizes, we followed general principles of stress concentration, where we increased the number of elements in high stress areas and decreased the number of elements in lower stress areas.

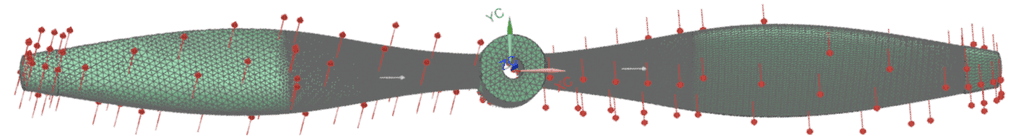
This starts by identifying areas of high stress using a relatively coarse mesh – in this case, a mesh size of 0.3 was used, as seen above. From the simulation results, we identified that the middle and outer portions of the blades (depicted in blue), along with the circular hub, were all areas of low stress. The stress was concentrated in the inner parts of the blade where the angular change in shape was quite extreme. From this analysis, the propeller was divided into five sections: the circular hub, the two outer parts of the blade, and the two inner parts of the blade. Following the general rule of element sizing, a smaller element size of 0.1 was used for the inner parts of the blades, or the high stress areas, and element sizes of 0.3 is used for the low stress areas identified earlier. The mesh setup for this combination is shown below.
Mesh Variations
Other variations with different element sizes for the low stress areas are conducted, including element sizes of 0.2 and 0.19. The simulation result for the 0.1/0.19 mesh combination was chosen as the final simulation and is shown above. From these results, it seems that the stress converges at a value of 4.51 MPa. To prove this result, the assumptions of linear analysis must be met. Due to the ideas that ABS plastic is proven to behave linearly in the simulation, the material properties stay the same, there is no material property downgrade, and there is no damage criteria, it is established that the stiffness matrix does not change.
Material Notes
The material used for the propeller is assumed to be ABS plastic. To prove that the ABS plastic used in the propeller is within the linear regime, the stress throughout the simulation must not reach the yield strength of ABS, or when ABS starts to deform. In this simulation, all the stress values recorded, including the absurdly large outlier and the converged value, are less than the yield strength of ABS, which is 13 MPa on the lowest end, thus establishing that all materials are in the linear regime.
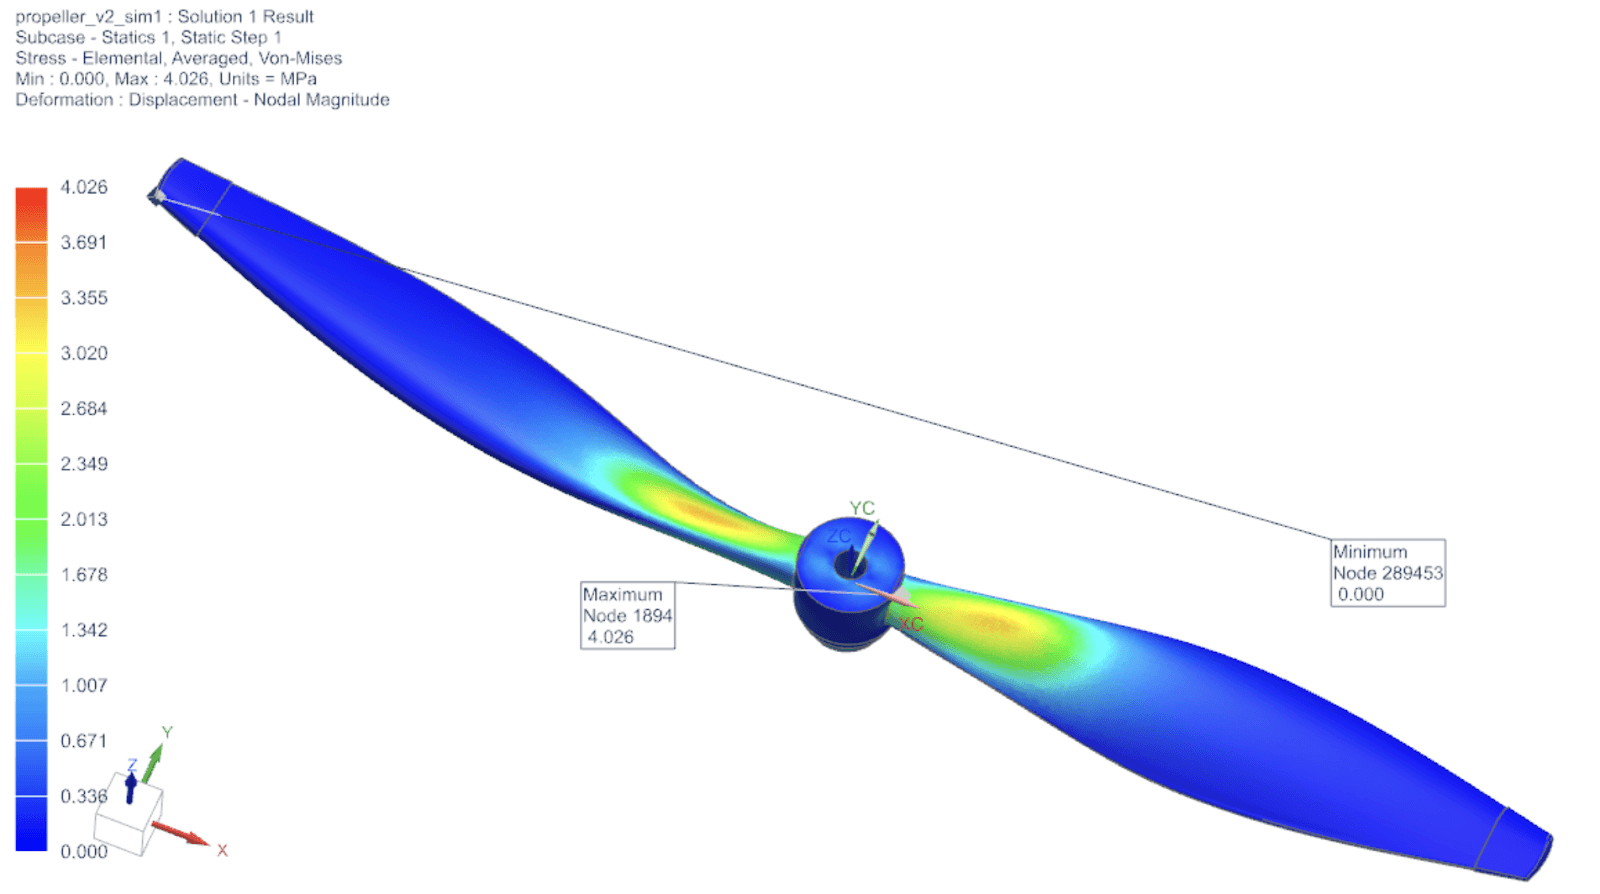
Results
The average deformation in the simulation is 0.441 mm, which is 2% of the length of one blade, or less than 1% of the length of the entire propeller. While the simulation may visually exaggerate this percent, this displacement is very small within context and establishes that there are no large displacements. Because all the criteria of linear analysis are met, it is concluded that the stress converges at a value of 4.51 MPa, with 251153 elements at a size of 0.1 for the high stress areas, 0.19 for the lower stress areas and a percent difference from the previous value of -9.03%.
Folding Arms
As described in the product description
Propellers
Simulation where all four propellers do not experience friction

Propellers with Friction
Simulation where rightmost propellers experience friction. It is clear that the propellers with friction take longer to start to gain rotational speed, but difference is negligible at higher speeds.